


Images, Resonances, Echoes, take 5
[Before you start, I hope you’re keeping well. If you prefer to read this in a browser, to make it easier to navigate the links, clicking on the title seems to take you to a web version].
Images - Stories of journeys
How to explain how to get somewhere? Draw a sketch map, perhaps including approximate journey times. Want to know how your latest allowed exercise went? Your phone could tell you about the journey, showing you the path followed, together with reporting all kinds of performance data – perhaps more of it than you wanted. There are many other examples where the stories of journeys are storied told in two dimensions of space and one of time. That's an abundant and accessible set of resources to hand for beginning to teach about motion. But it's all in two spatial dimensions, and traditionally physics teaching starts in one dimension, so discarding these available resources. Images in textbooks in introductory chapters on motion look nothing like journeys marked on two-dimensional maps.
Images of arrows also appear on screens. Here is one: A velocity vector, as reported by a GPS-enabled device held by a passenger in an Edinburgh-bound train.
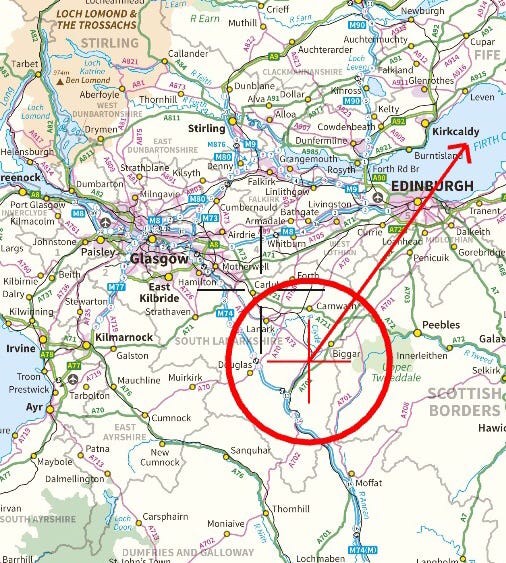
This vector requires careful interpretation - the train does not follow the line of the vector, nor is the passenger going to miss their destination. But it does show where the train is heading next, so predicting where the train will be soon, so long as soon is real soon. We're back with velocity accumulating displacement, as in IRE02, remembering that all predictions are risky, and the further into the future you extrapolate, the riskier the prediction. Here the velocity vector does change, and long before the train reaches Edinburgh.
Perhaps a combination of representing motion first in two-plus one dimensions, of using vectors as arrows, and of exploiting accumulation can provide a more fruitful route as an introduction to representing and reasoning about motion. And produce a better didactical transposition of kinematics.
Resonances - kinematics: accumulations and vectors
Let's try a new narrative line in kinematics that could work for many children while supporting the development of fruitful and intelligible styles and patterns of reasoning in physics for children 8-16 years old. (There is certainly a lot of evidence that the current widespread approach based on graphs and algebra all in one dimension leaves room for improvement ("Educational research tells you what not to do rather than what to do")). Maybe this approach will throw up issues, but I think there is a good chance that this suggestion removes many of the current tripwires, and no (discernible) new tripwires are laid (but that's where the comments come in).
Starting points:
Taking a point of view is essential for recording or noticing a motion or change in motion(all witnesses are in the end local witnesses, Newton's ideas of space and time notwithstanding).
Starting with accumulations, and reasoning about accumulations is a much simpler approach to looking at the kinematic relations that thinking about operational definitions based on rates which rely on calculations of differences and then divisions by infinitesimal times.
A better approach is possible with two spatial dimensions rather than in one dimension.
Use vectors to represent motion and delay representing motion on Cartesian graphs until kinematic ideas are well-established (Motion sensors and the representational mediation of software allows more freedom of choice about which quantities might form the basis for kinematics than in the era where only metre rulers and stopwatches were available).
Start with lots of real stories of motion in a horizontal plane(stories of journeys told in words and diagrams), mostly qualitative and semi-quantitative. These could be a 'drone's-eye' (perhaps even live) or 'bird's eye' view: a two-dimensional view of a tracked motion(GPS-enabled mappings are common). Encourage both first and third-person descriptions to be framed in terms of 'how fast, for how long and in what direction' or 'how far, and in what direction' to lay in a store of resources to draw on when predicting displacements from velocities. Maybe get out the toy robots, or go back to the future(Nuffield 'O' level) with strobed long exposure images.
Introduce motion diagrams on paper, with the separation of the images or dots representing a track segment. Connect this to the descriptions of journeys as sketch maps: from third-person and first-person points of view.
From these formal diagrams draw out the idea of taking a point of view and recording when something was where, so relating a sequence of displacements to the motion diagram. This sequence of displacements can then be simply represented by a series of stylised arrows, from the chosen point of view.
Then introduce accumulations, relating the velocity ( just shown by an arrow, perhaps on a map) to predictions about where the actor will end up. At this stage, 'velocity' is simply a label for the arrow, which shows 'how fast and in what direction', referring back to the groundwork you laid earlier on.
From here, segue into a series of predictive stories, starting with a sequence of velocities and predicting the displacements.
For each step of the story, you can focus on the detail of the accumulation, changing the velocity and duration of the step, thus varying the accumulated displacement. This accumulation, which is just addition (done by placing arrows tip to tail) is the crux of 'reasoning with arrows'.
You could look at successive intervals, seeing how changing velocities changed displacement.
Children add arrows to reason about what will happen. They predict a track, made of track segments, as before. These are the 'stories of journeys', from the lived-world. This prediction relates the experimental records(stories of motion) of motion with these predictive models.
These predictive stories(models) rely on 'velocity telling displacement how to change' (less demotically: velocity accumulates displacement), so introducing the first tautology of the pair that comprise kinematics.
Extend the idea of accumulations to acceleration accumulating velocity: it may be better to resist the temptation to place the velocity vectors tip to tail at this stage to avoid any suggestion of representing a track that is followed.
Again, you can look into the detail of the reasoning with arrows here.
Then, as a second step, link both accumulations, one after another, to predict the track of a journey.
This introduces the second tautology of kinematics ('acceleration tells velocity how to change', again in its natural two-dimensional environment).
So that's how you could introduce kinematics, exploiting vectors and the idea of accumulations. It's an example of how to reshape the curriculum using the idea of accumulation.
Echoes - resonance redux
That resonance is hard to describe with a predictive model (IRE03) does not prevent you from enjoying the demonstrations. Two favourites, both based on a vibrating aluminium plate, about 10 cm square, firmly bolted to a standard laboratory vibrator, driven from 0.1-10 Hz.
First, a very concentrated jelly, the more crenellations to the mould, the better, best somewhat chilled, driven to destruction(best to place the whole vibrator on a tray, to make tidying up afterwards easier).
Second, a set of narrow cardboard houses, of one, two and three stories, for illustrating the effects of earthquakes((floor area, 3 cm by 3 cm, height of each storey 5 cm).
And the difficulties of accounting for resonance? Well, you could always try coding up a model to give that seductive curve. Here is one – not yet as good as I'd like.
Anyone got a better one, where we can inspect the code to make sure that only fundamental relationships and interaction are in the code?
And next month, it'll be an almost-noble road to Energy. Just because someone cares.